CBOT Soybeans Price Chart March 2016 Chart

BEANS/CANOLA

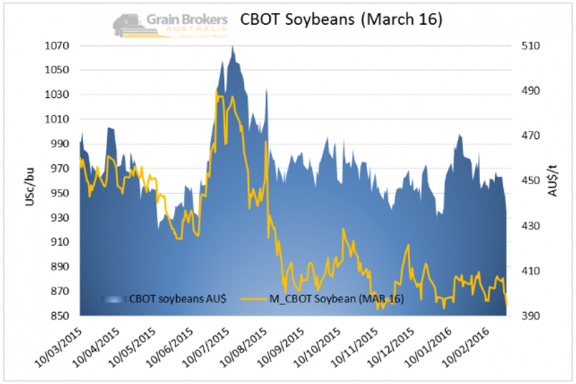
Chicago May-16 soybean prices lower for the week, at 859.0 US¢/bu, down 20.6 US¢/bu.

Chart 160227 WR1


Canola took a huge knock over the week with ICE Canola March 16 finishing at CA$447.8 down CA$16.4/t for the week.

Chart 160227 WR2


Canola was the hardest hit over the week as China formally confirms, that it plans to toughen its standard for imported Canadian canola reducing the amount of foreign material allowed from 2.5% to 1.0%. – With talks that they will do the same to Aussie canola specs.

The Canadian Dollar continues to climb higher weighing on values.

The USDA estimate US farmers will plant 82.5 million acres of beans which would be the third-highest on record.

The Brazilian soybean harvest crop continues to grow with harvest currently around 25% completed, estimates show the harvest will certainly be over 100 million mt.


To read the full report click below
Weekly Report 16_02_27

Calculate Our Impact

Calculate Our Impact

Our clients consistently receive above average prices for their crops.

Discover how much impact we would have on your returns.

Test our grain prices
Who We Help

We provide trusted advice for the returns you deserve

Our Achievements

We aim to market your grain in the top 10% of grain prices.

20M+
Tonnes transacted nationally
$35
Value added per tonne
2500+
Growers transacted on average

“Thanks to the excellent advice and strategic insights provided by Grain Brokers, I have been able to maximise my farmgate returns. I would highly recommend their grain marketing expertise to anyone looking to achieve similar results.”

Gordon - Kojonup, WA

Contact Us

Give us a call on our number below or send us an email with your name, contact details and enquiry.