USDA WASDE Report – Special Market Strategy Update
The USDA WASDE report is out and as with last month, provided some fairly US-centric views of expected changes to global trade in 18/19. The vast majority of the changes to the global balance sheet were reflected in the US with general increased production potential. A few surprises out of the FSU region has the market scratching its head. Overall the report on the surface is slightly bearish given the numbers, however, the view of many in the market is the underlying tension on export demand continues for cereals. Oilseeds continue to be mired by the trade tensions between the US and China providing little clarity in price direction.
On the domestic front the trade are working on the task of feeding eastern Australia for the coming season. With significant supply deficiencies in eastern Australia, the logistic task of moving grain west to east, south to north continues by road, rail and ships. There is also talk of the eventual importation of feed from overseas with expectations of Canadian wheat and US corn being sourced to feed domestic capital city markets. As noted in the last message to growers there is to some degree a tendency at the moment to dismiss the current global situation, as for much of Australian production, the focus is purely on the deteriorating domestic situation. While this is the main price driver locally at present we need to be slightly cautious on how buoyant we get on price support coming into harvest and the new year. Domestically, much depends on the spring weather (not looking great so far) and any potential for upside in production or further deterioration of the crop. At some point either domestic prices will get high enough to promote importing feed (import parity) or global values sink lower enough to do the same. Either way this market is close to import parity levels and general consensus is, when the domestic supply is sorted out one way or another by the consumer, prices will come back. In the past we have seen prices come down swiftly at this point.
Wheat
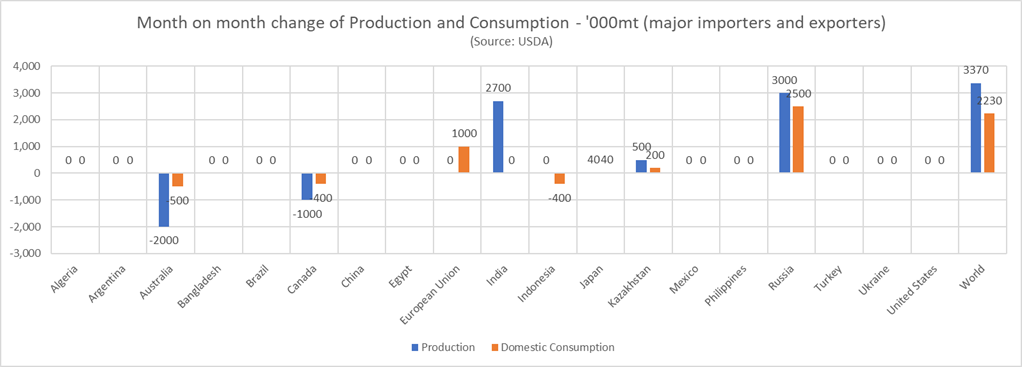
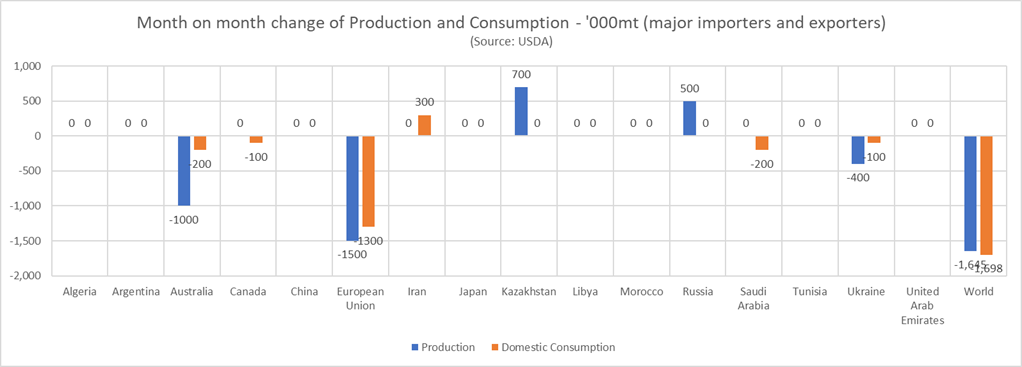
The outline of monthly changes by the USDA in the September report for major wheat importing and exporting nations is shown in the chart below. Given the recent well-publicised production issues in major production regions of the world, the increase by the USDA in world production by 3.37Mmt has a few scratching their heads. Production estimates for the 18/19 season was lifted in India (up 2.7Mmt), Kazakhstan (up 500Kmt) and Russia (up 3Mmt). Production estimates were decreased for Australia (down 2Mmt to 20Mmt – still likely around 2Mmt too high with ABARE alone at 19.1Mmt) and Canada (down 1Mmt). There has also been a change in imports by Indonesia indicated for this season, dropping 1Mmt to 10.5Mmt. Exports from Australia were dropped by 2Mmt to 14Mmt – still well over current trade estimates of 11.5-12Mmt, Canadian exports were lowered 500Kmt.
The USDA has made some interesting changes to domestic consumption which contributes to the seemly bearish numbers from the report. Australia domestic consumption was reduced by 500Mmt, to 7.6Mmt (around 1Mmt lower than current trade estimates). Domestic consumption was also lower in other significant regions; Canada down 400Mmt and Indonesia down 400Mmt. Conversely, domestic consumption was also increased in significant regions; the European Union (up 1Mmt) and Russia up 2.5Mmt. As a result of the changes, and quite perversely in some instances, ending stocks were increased in Australia (up 1Mmt), India (up 2.3Mmt), Kazakhstan (up 300Mmt) and Russia (up 2.05Mmt).
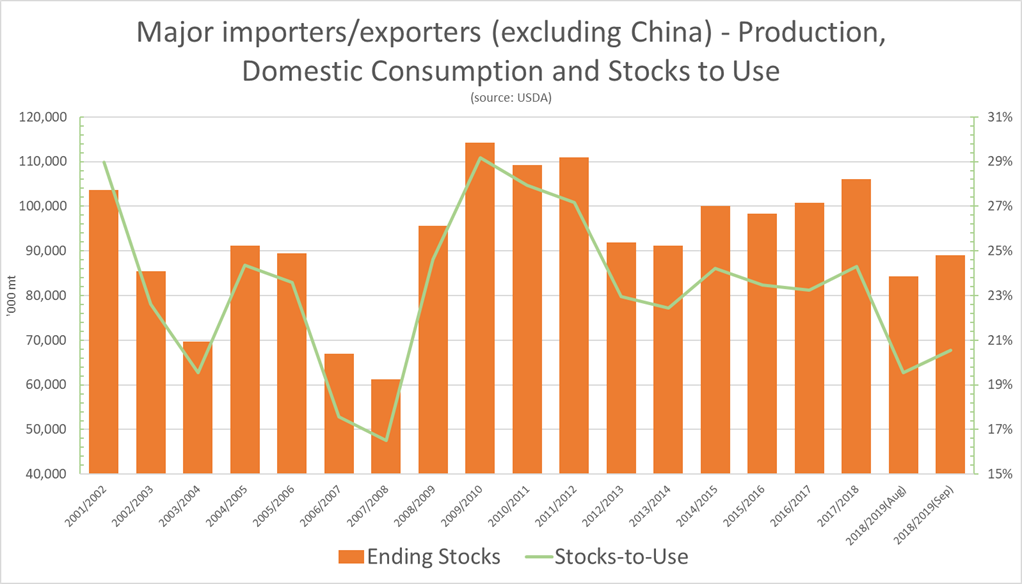
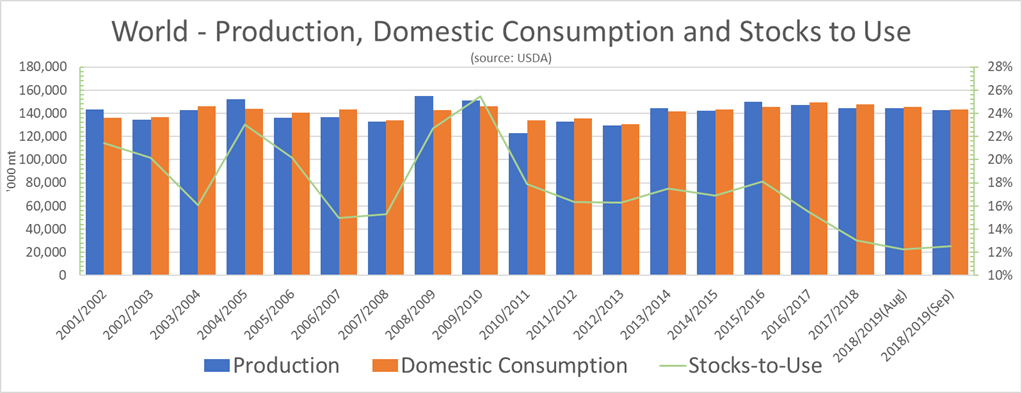
So, overall despite USDA reporting, world production will decline 25.2Mmt year on year, domestic consumption increasing 4.6Mmt year on year and ending stock declining 13Mmt year on year, the world stocks to use ratio remains comfortably at 35.13%, up 21 points on last month’s report.
Over the last few reports, we have been talking about where global wheat stocks are located with the emphasis being on the vast majority of world wheat stocks being held in China. This effectively means the majority of world wheat stocks are not available for export. The chart below shows the impact of the stock’s position of major importers and exporters as a result of the latest USDA WASDE numbers. We can see the balance sheet has loosened up a little and on the surface contributes to the bearish theme of the latest report. There are a few factors that need to be considered in focusing on the potential price drivers in this scenario. As we have been hearing and reading there is a very good chance that Russia will restrict wheat exports at some stage this year or very early in 2019. Russian export pace has been phenomenal with exporters rushing to make sales and execute before any government intervention. Current estimates cap Russian exports for the season at 35Mmt (USDA), a 6.4Mmt year on year decline. IGC are currently forecasting 30.7Mmt. Once Russian exports are exhausted, demand will shift to the US providing expectations of price support.
As we have seen with the US/China trade dispute, any major government intervention in world trade flows can have a significant impact on global prices. Currently, the USDA report has likely dampened the market in the short term – on the back of expectations of increased global stocks in major exporting regions. We do however believe longer-term fundamentals will prevail with a shift in export demand to the US and resulting price support into the new year.
Barley
The world barley balance sheet continues to be historically tight, supported also by an overall historically tight coarse grains balance sheet. As with wheat, the latest USDA report lifted production estimates in the Black Seas region which, in the case of barley has offset some of the declines seen in EU and Australia. While USDA reduced Australian barley production by 1Mmt to 7.8Mmt, this is still around 1Mmt over current trade estimates. Australian exports are predicted to be around 5.8Mmt, again higher than current trade estimates of around 3.6Mmt.
We are also seeing the tight global supply and resulting global price situation in barley rationing demand. A shift that is seeing a resulting lift on global corn consumption and provided a slight lift in the world stock-to-use for barley in the latest report.
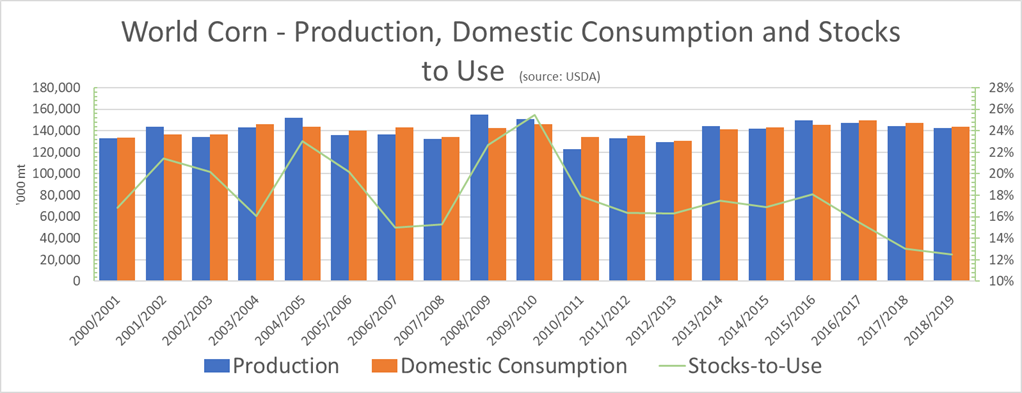
Significant observations from the USDA report for corn show production in the US and EU was lifted 6.1Mmt and 1Mmt respectively. European imports were lifted 1.5Mmt and US exports were lifted 1.27Mmt. Domestic consumption was also lifted 3.5Mmt in EU, a 6Mmt jump year-on-year. Similarly, US domestic consumption was lifted 1.9Mmt, a 4.95Mmt lift year-on-year.
Overall global coarse grain stocks continue to be tight with ongoing price support expected for barley in 18/19. Our domestic market will continue to be supported by internal requirements.
Canola
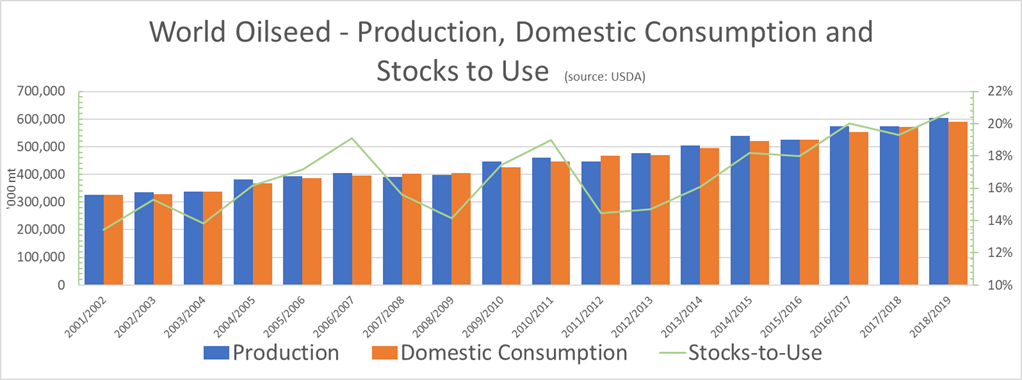
The soybean balance sheet continues to remain loose with the USDA report seeing little month-on-month change from a global perspective. Year-on-year changes continue to pressure soybean prices with world production up 32.5Mmt and ending stocks expected to increase to by 13.5Mmt. US production was lifted 2.9Mmt from the last report (with ending stocks up 1.6Mmt) and China’s imports reduced a further 1Mmt the soybean market remains under pressure. Overall the world total oilseed balance sheet remains weighty.
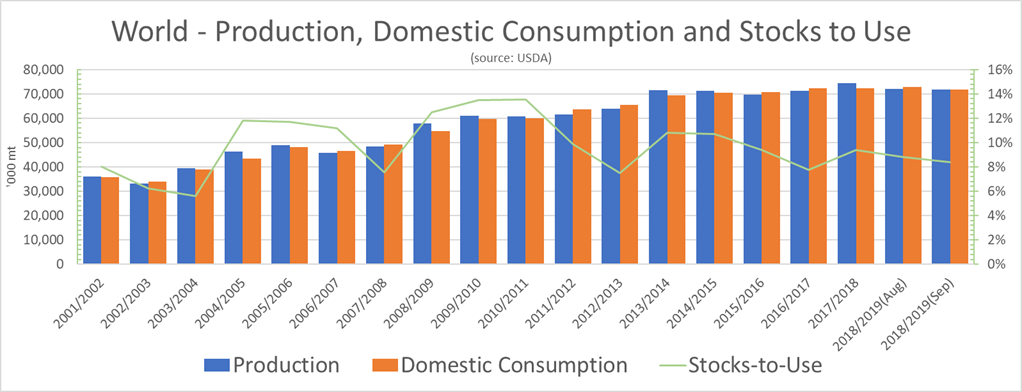
The canola balance sheet shows a little of the opposite. World canola production was reduced 450Kmt month-on-month for major importers and exporters in the latest report, but this has been offset by the 825Kmt decline in domestic consumption expected in the major importing and exporting regions. Surprisingly, USDA left Australian Canola production unchanged at 3.2Mmt, or close to 1Mmt over current trade estimates and exports at a heady 2.6Mmt. Overall expected world production of canola in 18/19 has declined with the stocks-to-use falling 41 points to 8.4%.
Canola will remain challenged by the headwinds of the heady global overall oilseed balance sheet and the continued consternations of the US/China trade tiff. The tightening global canola balance sheet combined with the challenging production season domestically would be expected to continue to provide some underlying price support for canola into the 18/19 season.