CORN/BARLEY
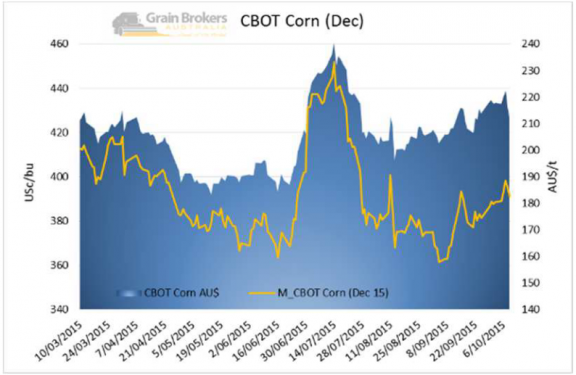
2015 CBOT corn futures were up slightly for the week, from 388.75.6c/bu to 391.2, a rise of 2.75c/bu.

The USDA report was considered bearish against trade expectations as yield and production were a bit higher than expected. The USDA report was expected to show lower yields and harvested area in the US. However the figures were slightly up from the previous month.US corn yield came in at 168 bu/acre, up from 167.5 bu/acre in September and above the average trade estimate of 166.4 bu/acre.
World ending stocks came in at 187.83 million tonnes from trade expectations for 188.7 million. Last month’s estimate was 189.69 million and last year’s (2014/15) was 196.03 million tonnes.
US Corn harvest gained momentum this week, pushing to 27% harvested, this is still 5% below average for this time of year. Local pricing has remained relatively unchanged for the week.
To read the full report click the link below.
Weekly Report 15_10_09